Problem statement
- The problem
- Why it matters
- Project goal
The accurate and efficient classification of crops grown on smallholder farms in Africa and the Global South is a significant challenge compared to developed nations. This is primarily due to factors such as: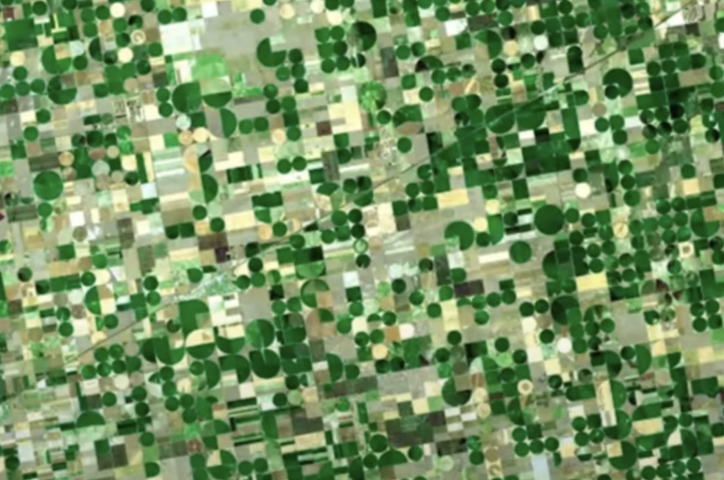

- Data scarcity: Limited availability of high-quality training data, particularly for diverse crop varieties and growing conditions specific to these regions.
- Image variability: Variations in crop appearance due to factors like soil type, climate, and cultivation practices, making it difficult for traditional classification models to generalize.
- Lack of infrastructure: Limited access to advanced technologies and infrastructure, hindering the deployment and maintenance of sophisticated classification systems. Economic constraints: Resource limitations and financial constraints often restrict the adoption of advanced agricultural technologies.
Crop circles in Kansas, USA using Advanced Spaceborne Thermal Emission and Reflection Radiometer (ASTER)
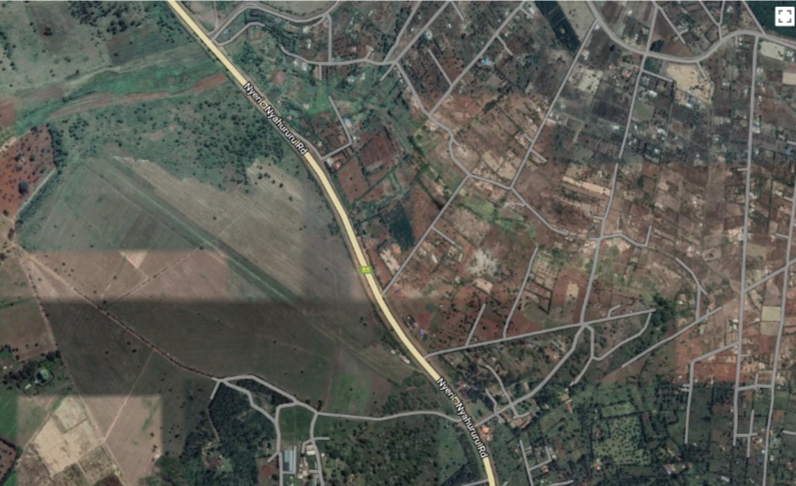
Coffee farms in Nyeri, Kenya using Sentinel-2
Rice fields in Vietnam along the Mekong Delta Sentinel-1
Requirements and output
- What's needed
- The output
- Satellite imagery from Sentinel-1 and Sentinel-2 (10m resolution required for monitoring smallholder farms)
- Georeferenced crop type labels (ground truth)
- Existing land cover maps
- Crop calendar for temporal and crop growth cycle
Step-by-step workflow
1
Create agroecological zones.
Using soil type, altitutude, rainfall, soil moisture, and temperature data to create homogeneous zones that can subdivide the broad area of interest into smaller zones based on their agroecology. Agroecological zones are also referred to as AEZ.
2
Create a stratified sample based on the crop type.
Determine the AEZ that grow different crops and their distribution using historical data. Distribute a number of samples to the specific AEZ that grow a certain crop. It is recomemend to have at least 30% sampling. Within each AEZ, randomly select farm sasmples from each AEZ where data will be collected from.
3
Create a region-based crop calendar based on the agroecological zones.
Using climatic variables, such as rainfall, crop season, and temperature data, create crop calendars, which contain the planting date, harvesting date, and the time periods for each growth cycle. These crop calendars will be a precursor to crop stage determination and satellite imagery selection for crop type mapping in later steps.
4
Extract band information and vegetation indicators from satellite imagery.
Extract bands and vegetation indicators from Sentinel-1 and Sentinel-2 satellites. Carry out dimensionality reduction to remove redundant bands and indices.
5
Create positive and negative labels from the dataset and ground truth data.
Use unsupervised learning (e.g., k-means) on the satellite imagery. Overlay ground truth data of the unsupervised classes. Determine the classes and the ground truth data the intersect, and then determine the frequency. THe classes that have few-to-none pixels intersecting will be labeled as negative pixels (i.e., -ve). The ground truth data will be used as positive labels.
6
Train a model and evaluate.
Use random sampling from the negative pixels (i.e., all other land cover classes) and positive pixels (i.e., crop types). Divide the data into training and test datasets. Carry out multi-class classification. Train the crop type model. Carry out model evaluation and report the findings. Apply the trained model to classify datasets from Sentinel-1 and Sentinel-2 using the relevant band and indices.
7
Optional: Adapt for other crops and regions of interests.
Use transfer learning to adapt the model to other crops and regions.